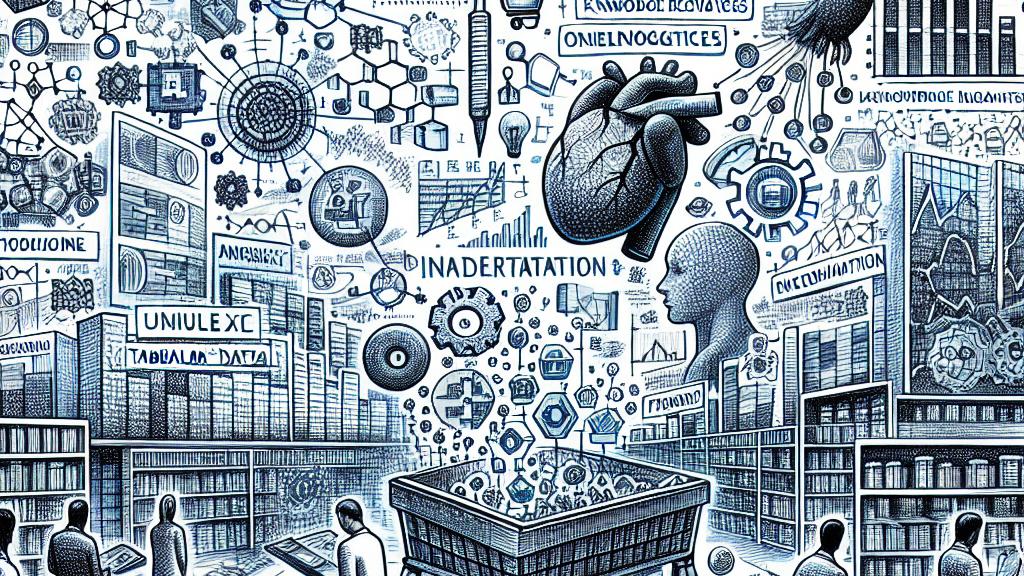
Exploring Semantic Interpretation of Tabular Data
Overview
- Dive into the vital role that Semantic Table Interpretation (STI) plays in data analysis.
- Uncover the intricate relationship between explainable AI (XAI) and tabular data utilization.
- Discover how knowledge graphs can illuminate and clarify complex data insights.

The Significance of Tabular Data in Modern Contexts
Tabular data is everywhere—whether you're crunching numbers for a financial report, analyzing patient outcomes in healthcare, or even organizing product inventory in retail settings. Not only is it straightforward, but this format also holds vast potential for data analysis and decision-making. For example, hospitals that use tables to organize patient information can easily identify trends in treatment effectiveness. The insights derived from such structured data can lead to improved patient care and operational efficiencies. The research on Semantic Table Interpretation (STI) sheds light on the techniques that can be implemented to annotate and enrich this data with semantic meanings. By using ontologies and background knowledge graphs, industries can automate the extraction and interpretation process, turning data into a strategic asset rather than just numbers on a page.
Navigating the Realm of Explainable AI and Tabular Data
As artificial intelligence (AI) continues to infiltrate various sectors, the need for explainable AI (XAI) becomes paramount. Let’s face it—when algorithms crunch critical data in sectors such as finance or healthcare, stakeholders want to know how decisions are made. A clear example is when banks assess loan applications using intricate algorithms; transparency is essential to ensure fairness and legality. The literature on XAI emphasizes that understanding how models reach conclusions not only fosters trust but also enables users to challenge and refine these models effectively. The review dives into various XAI techniques suited for interpreting tabular data, outlines the challenges still present in the field, and proposes exciting research directions that could enhance our ability to explain the workings of these algorithms. In essence, effective explanations serve as the bridge between technology and ethical decision-making.
Unlocking Insights with Knowledge Graphs
Knowledge graphs are transformative tools that can elevate the comprehension of complex datasets to new heights. By representing information in a graph format, companies can visualize relationships between data points, revealing hidden patterns that would otherwise remain obscure. Consider a retail business analyzing customer behavior; by employing knowledge graphs, they can quickly uncover which products are frequently bought together, leading to more tailored marketing strategies and improved customer experience. The literature emphasizes the powerful synergy between STI and knowledge graphs, suggesting that their combined use can revolutionize how data is perceived and understood. As we look toward the future, the potential for integrating these approaches not only promises greater clarity in data analysis but also opens doors to innovative applications that can transform industries from healthcare to finance and beyond.

Loading...