Understanding Supply Chain Through Visualizations

Overview
- Visual tools illuminate the complexities of supply chain dynamics, making them accessible.
- Collaboration between researchers and visualization experts fosters greater public understanding.
- Urgent action is needed to address climate change’s impact on global supply chains.
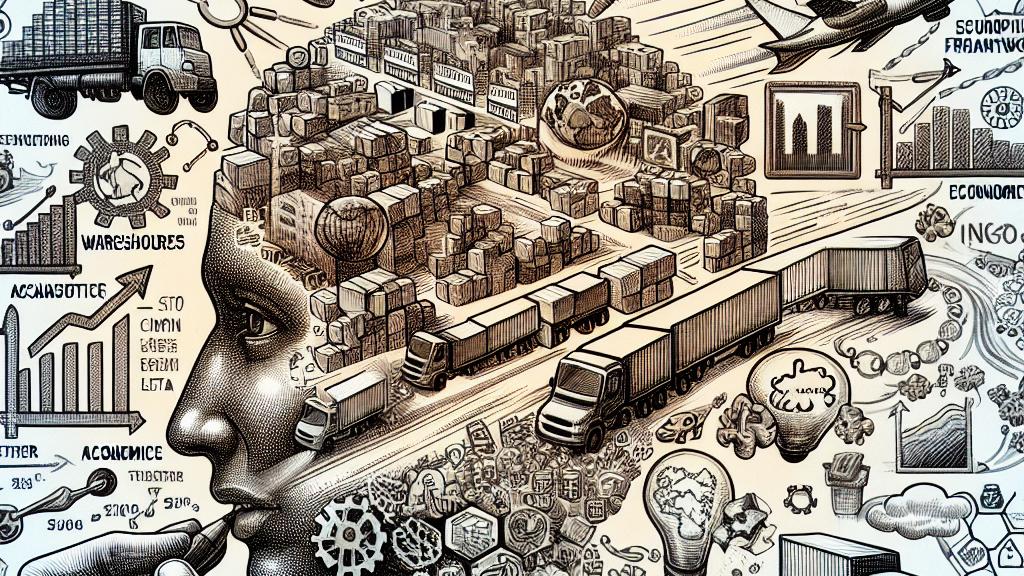
The Essential Role of Visualizations
In the intricate landscape of supply chain management, particularly within the vibrant economic framework of the United States, visualizations serve a vital function. They do more than clarify; they transform daunting data into compelling insights that anyone can grasp. Take, for example, the work of Sandy Dall'erba, a passionate professor at the University of Illinois. He believes that engaging visuals are not merely helpful but absolutely essential. By rendering complex agricultural and climate-related data into rich infographics or dynamic animated videos, Dall'erba enables critical information to flow from an academic realm into the hands of policymakers and the public. Imagine substituting dense reports with a captivating, colorful animation that effectively conveys essential trends; this is the astounding potential of visual storytelling!
Creative Collaborations Yielding Insightful Results
One of the most inspiring aspects of Dall'erba's approach is his collaboration with David Bock from the National Center for Supercomputing Applications. Faced with the monumental task of making sense of a data mountain—40,000 entries illustrating agricultural exchanges across nations—they creatively merged their expertise. Their breakthrough creations include stunning animations that capture the intricate web of agricultural trade worldwide. Visuals, such as animated maps showing the flow of goods, highlight that the size of each arrow represents export value, thus giving viewers a clear picture of global trade dynamics. Thanks to these innovative approaches, information that was once considered dry and technical has been transformed into engaging narratives that resonate and linger in the audience's minds.
The Crucial Connection: Climate Change and Supply Chains
Today, the imperative link between climate change and supply chain integrity has garnered urgent attention. The latest findings from the IPCC underscore a chilling reality: climate-related disruptions, like escalating temperature swings and unpredictable droughts, threaten food production and critical supply routes across the globe. Dall'erba's ongoing research aims to expose these intricate relationships, revealing how diminished water resources directly affect agricultural output and trade viability. Each visualization becomes not only a tool for comprehension but also a powerful reminder of our pressing responsibilities. It is evident that grasping these connections is fundamental to crafting adaptive responses; in other words, understanding how climate dynamics influence supply chains is the first step toward building resilient systems capable of thriving amidst uncertainties.
References
Loading...